|
01670 732139 |
 |
steve@itseasy.co.uk |
How to use PowerPivot in Microsoft Excel
PowerPivot in Microsoft Excel
How to use PowerPivot in Microsoft Excel. This tutorial explains how to create a relationship between two Excel tables, which have been formatted as tables, using the PowerPivot tab. The video explains how to use the Manage options in PowerPivot and how to link the tables using the diagram view.
Check out online courses at http://www.itseasytraining.co.uk
Overview
This section explains how to add relationships between tables using PowerPivot in Microsoft Excel.
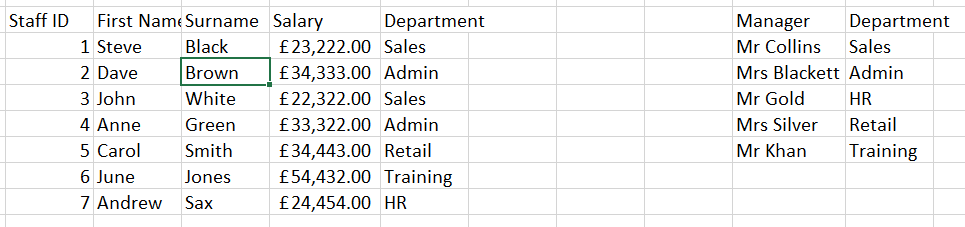
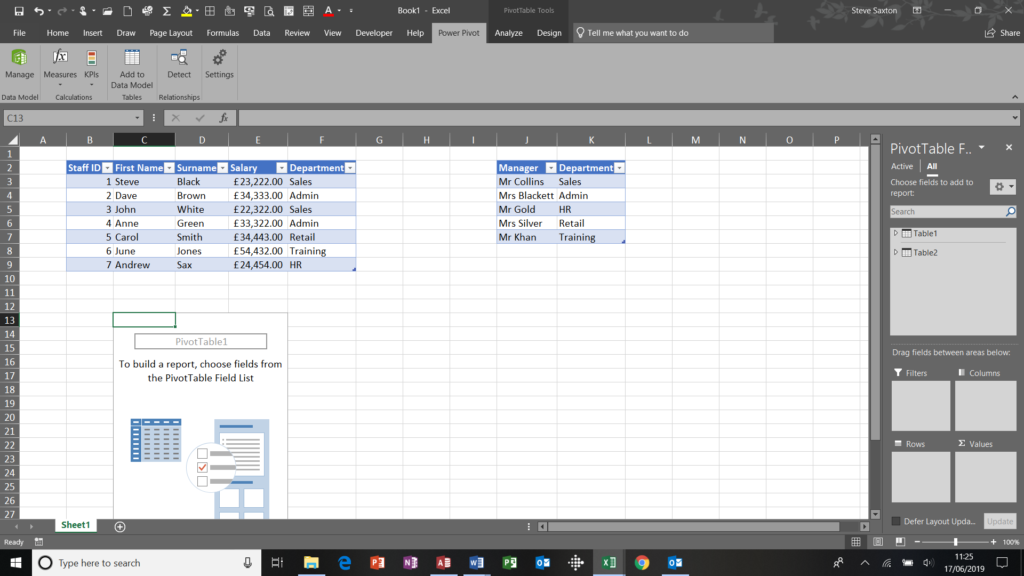
In the above example there are two small tables of data which I am going to join using the PowerPivot window. When I add the two tables to the data model, they will formatted to Tables. You can rename the tables on the sheet tabs, or use named ranges.
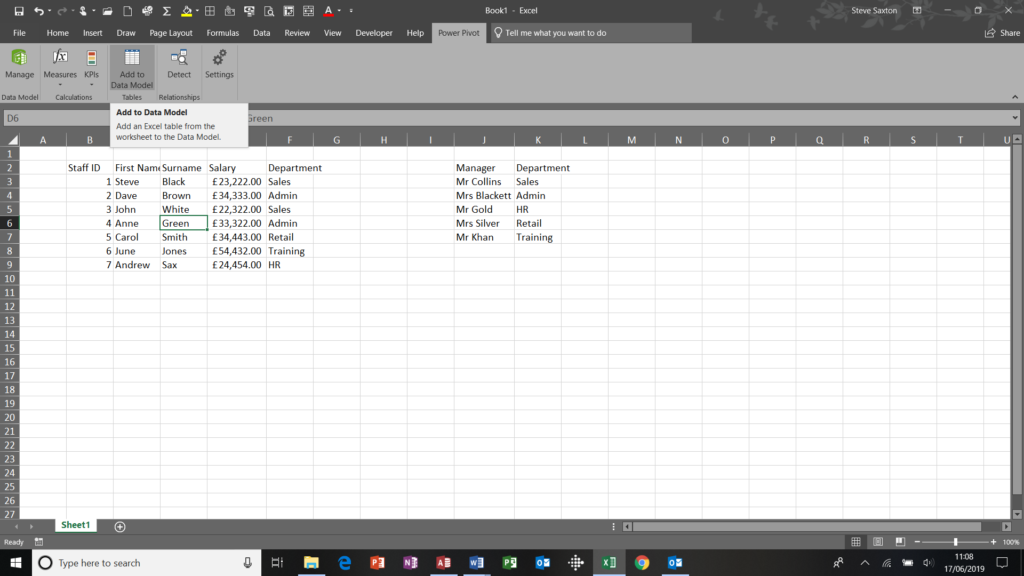
First step is to add each table to the data model.
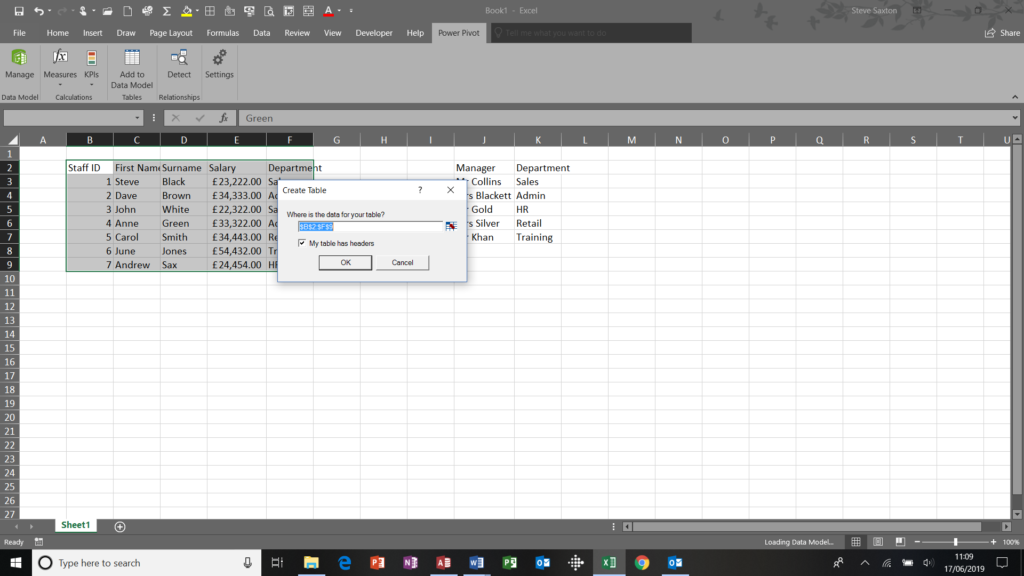
Make sure that you check the My Table has Headers option. The following screen is displayed, cancel this screen to add the other table.
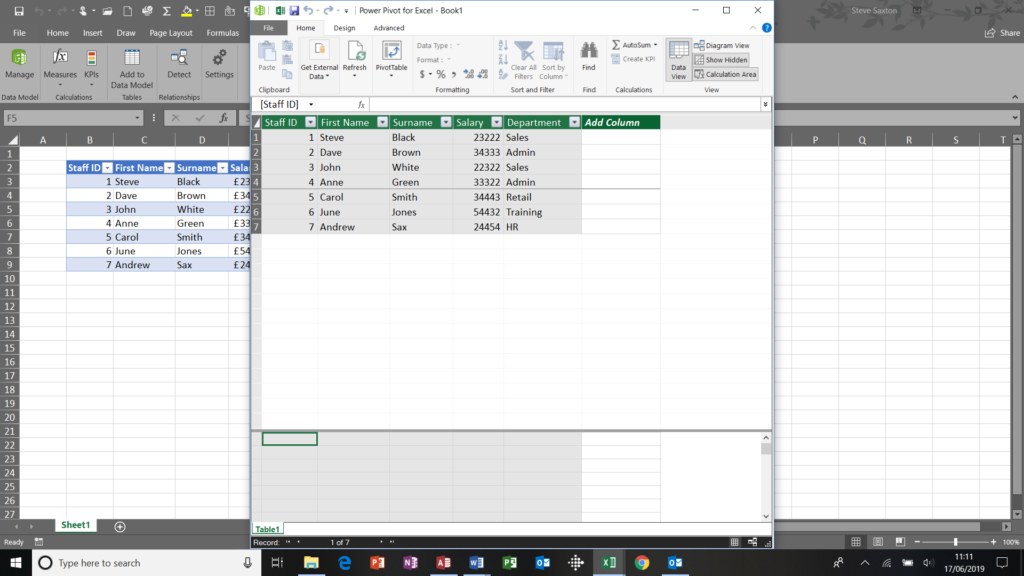
When you add the second table, you will see a second tab appearing in the PowerPivot window. You can name the tabs if required.
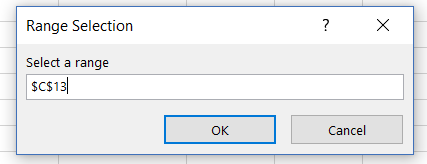
You may notice that you can import data from this window as shown before. We are now going to create a Pivot table based on these two tables. Select the Pivot table button and select where you want the Pivot Table to sit. You can also select the Pivot table option from the Manage window. The Manage windows allows you to select quite a few different Pivot table and chart options.
You will notice that both tables added to the data model now appear in the Pivot field window.
I am going to link these two tables via the department field. I can do this through the normal Pivot table tools tabs, but I find it a lot easier to use the PowerPivot window and the Diagram view option, because it is more visual
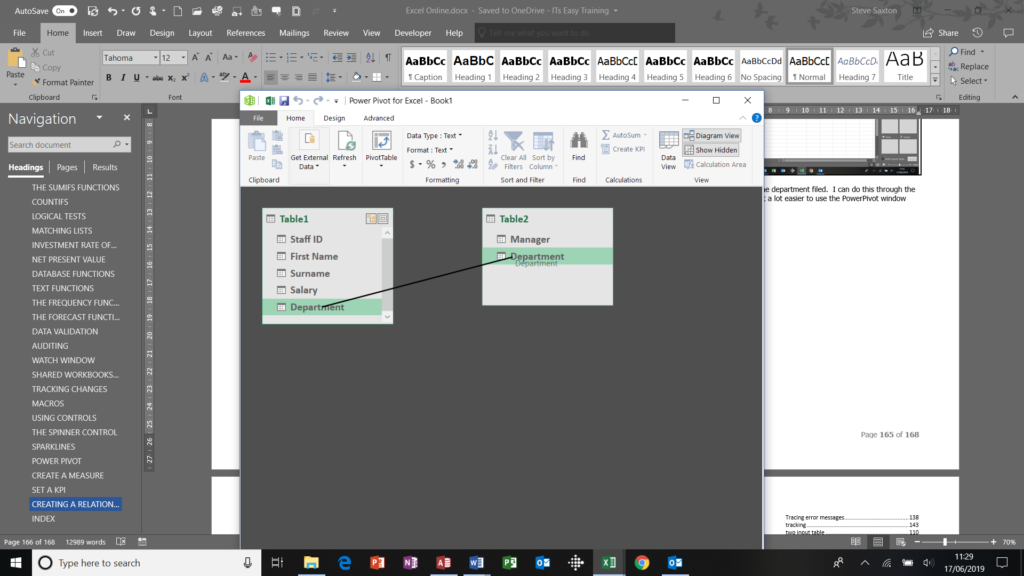
Drag the department field from one table to the department field in other table, when you release the connection is made. Once the relationship is created you can use field from both tables as shown below:
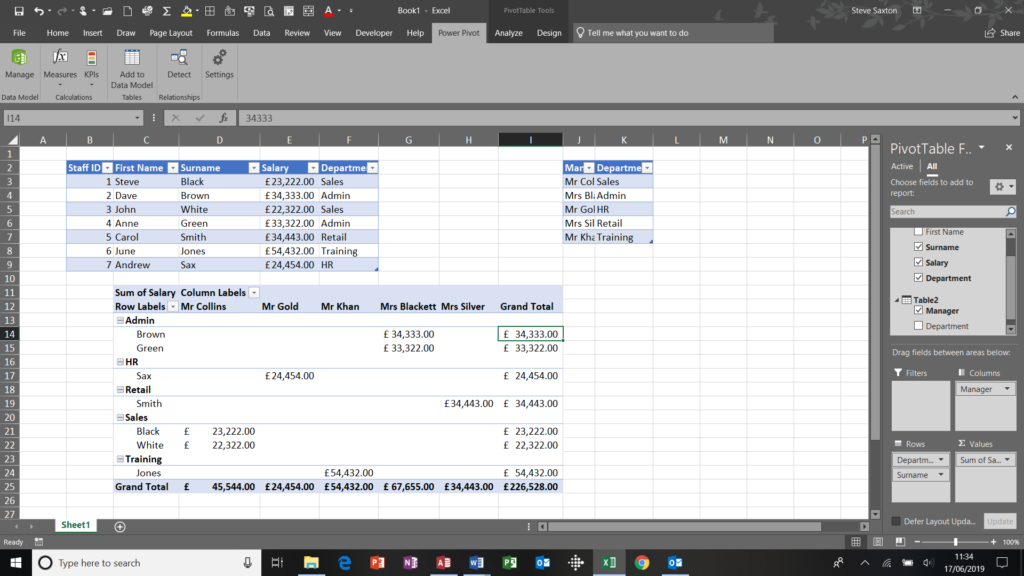
I have department and surname set to row from one table and manager set to column from the other table. Salary is the summary field.
Excel courses can be found at https://www.itseasy.co.uk/courses/excel-training/
Online courses can be found at http://www.itseasytraining.co.uk
Testimonials
 “Steve delivered a number of Microsoft Office Training Sessions to a range of employees across Newcastle College. The service provided by Steve is second to none. I have no hesitations in recommending him to other employers.”
Christine Jackman
Learning Manager(North) - Winner of Training Programme of the Year NECCA
 “I studied with Steve when we completed our CiPD CTP together. During the course I found Steve to be very personable and also very professional. Steve was first on my list of suppliers. Steve was very competitively priced and very accommodating.”
Simon Snowdon
European Training Manager at HP Enterprise Services

Craig Forster
Estimator, John F Hunt Regeneration Ltd
 “Steve’s background in IT training clearly provided him with great organisational and managerial skills which he put to good use at Second Chance Enterprises. His ability to see the long term strategy as well as manage the day to day management is one of his biggest strengths.”
Chriss Graham
Project Coordinator at Daisy Group